Part 1 | Ten multinational drugmakers paid seven-tenths of upfront cash
China Biopharma Out-Licensing and NewCo Deal Survey Report (2026) — Deal structures, payment realization and value benchmarks
InLight Editorial · November 2026
Original InLight research. Reproduction, excerpting or redistribution requires written permission.
Part 1 of a 12-part series · Published
InLight Editorial · November 2026
This InLight survey examines 237 China-origin out-licensing and related deals, supported by company announcements, exchange and SEC filings, and partner releases. Separately, 25 publicly available agreements were coded clause by clause. This 12-part series presents the findings; the full report contains the transaction-level records and sources. [1,12]
Part 1 quick read · Four key numbers from the InLight survey.
1. The headline and the cash are different numbers
China's out-licensing boom makes billion-dollar headlines familiar. DIA Global Forum, citing PharmCube NextBiopharm, reports that annual deal count rose from 94 in 2024 to 157 in 2025, while headline value increased from $51.9bn to approximately $135.7bn. But headline value is not the cash upfront contractually agreed at signing. [13]
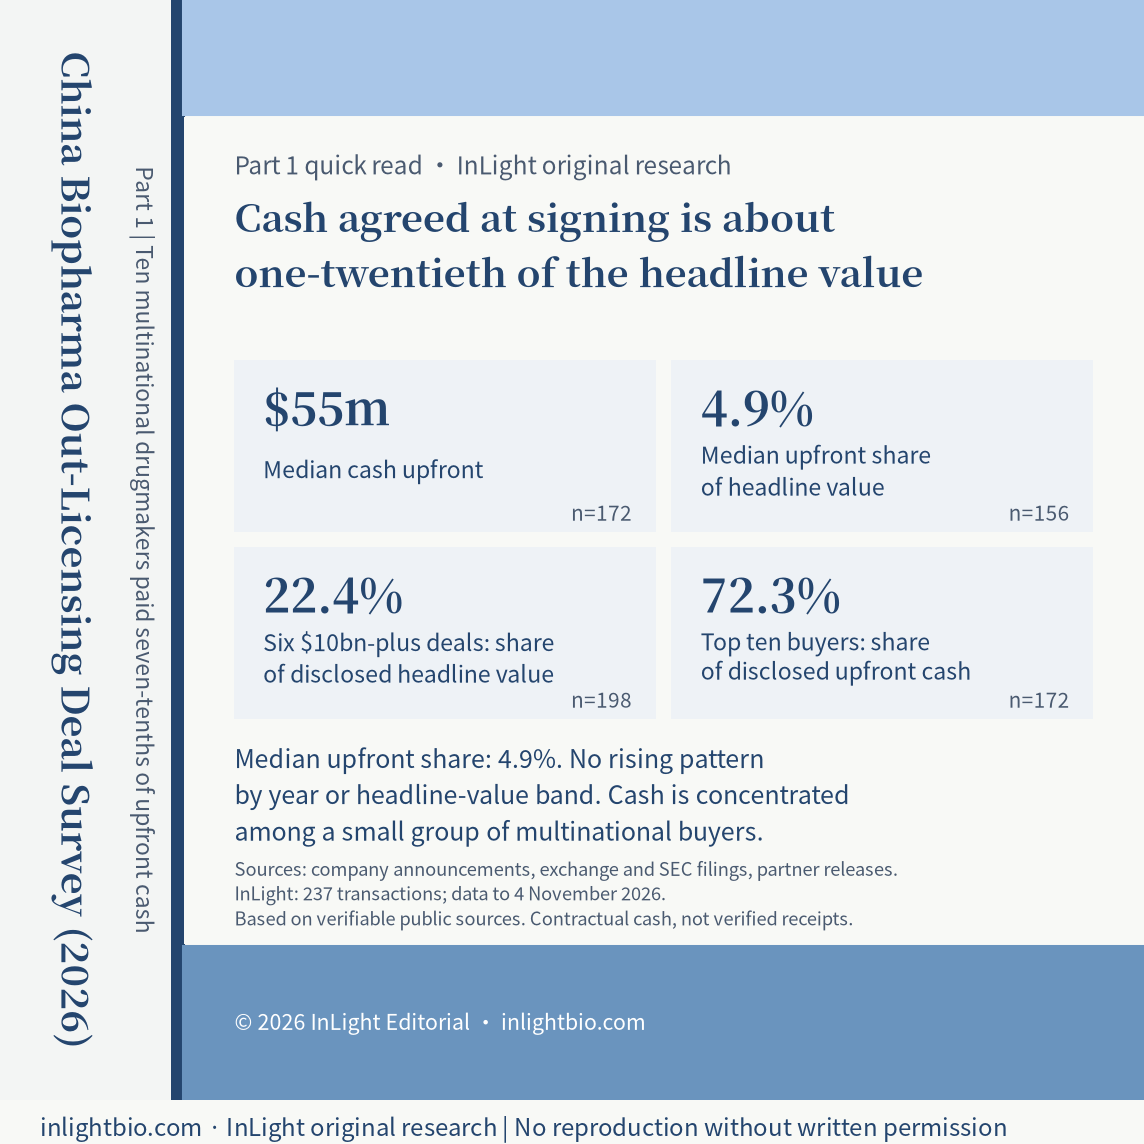
In our 237-deal sample, 198 disclosed headline values: the median was $1.1105bn and the mean $1.882bn. Among 172 deals disclosing separable cash upfronts, the median was $55m; the middle half ranged from $20m to $121.25m. [1]
Excluding two all-cash acquisitions—Genmab/ProFoundBio and Gilead/PepStar—leaves 156 deals with comparable upfront-to-headline ratios. Their median was 4.9%, with an interquartile range of 2.6%–7.5%. A nominal "$1bn licence" therefore typically promises about $50m upfront, not $1bn at signing. The pooled ratio is 6.6%; it is a different measure, not an alternative estimate of the deal-level median. [1–3]
2. Record deals lift the mean, not the upfront share
The mean upfront was $153m, 2.79 times the median. The ten largest upfronts account for 40.9% of disclosed cash; remove them and the mean falls to $96.24m. Medians and quartiles better describe an ordinary licensor's position. [1]
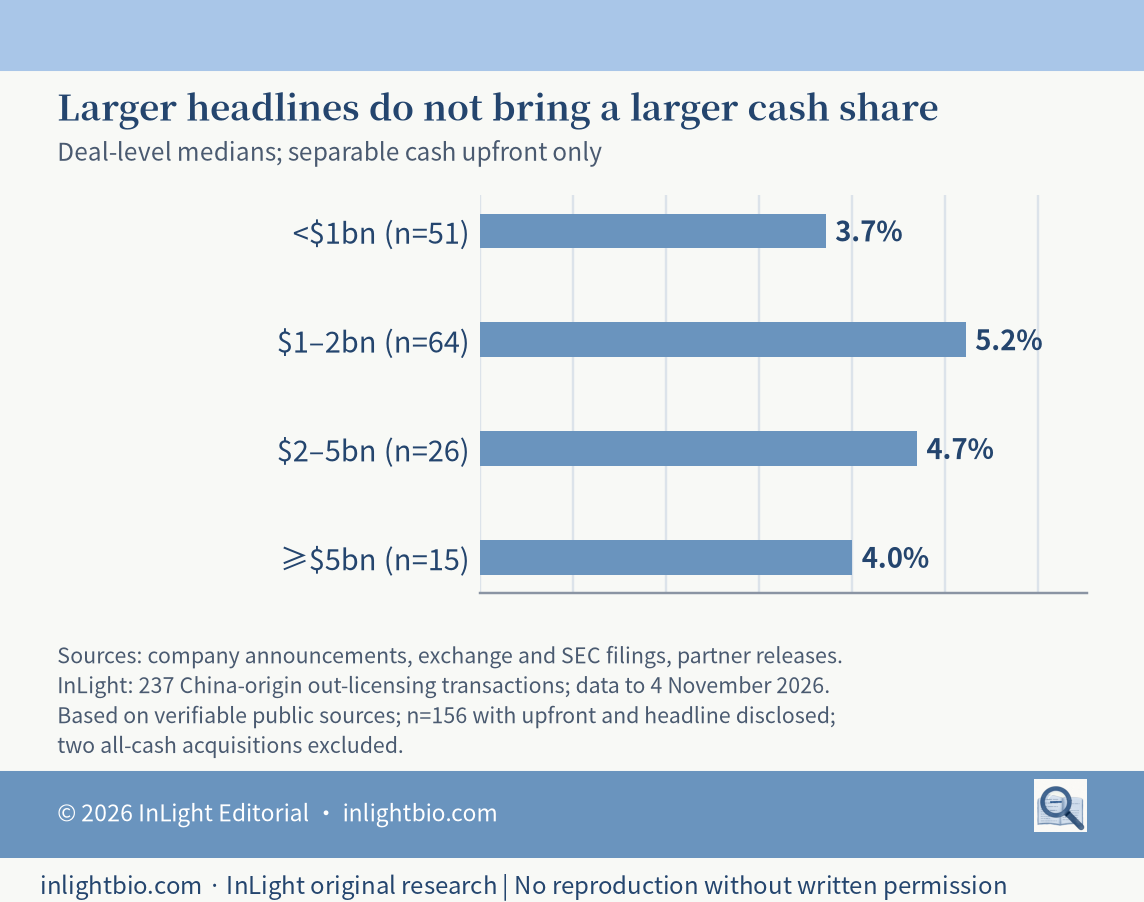
Nor did the ratio rise consistently over time. Annual medians were 5.4%, 4.9%, 3.9% and 5.0% for 2023–2026, with ratio samples of 27, 35, 48 and 46. By headline size, medians were 3.7% below $1bn, 5.2% at $1–2bn, 4.7% at $2–5bn and 4.0% at $5bn or above. [1]
Figure 1. Median cash-upfront share by headline-value band, n=156.
3. Six enormous headlines
Six deals announced between July 2025 and October 2026 exceeded $10bn in reported headline value. Together they represent approximately $83.6bn, or 22.4% of the disclosed $372.6bn total. Their combined upfronts were $4.45bn—just 5.3% of their combined headlines. Individual upfronts ranged from $0.4bn to $1.2bn, equivalent to 2.6%–9.6%. [1,4–9]
Those six were Hengrui/GSK, Innovent/Takeda, CSPC/AstraZeneca, Hengrui/Bristol Myers Squibb, Innovent/Pfizer and Hansoh/Roche. All buyers were top-20 pharma companies. Multi-programme packages, including CSPC's eight programmes, Hengrui's HRS-9821 plus eleven GSK options, and Hengrui's thirteen BMS programmes, accumulate distant milestones into impressive headlines. They do not imply equivalent cash per programme. [4–9]
The announced upfront/headline pairs were $0.5bn/$12.5bn for Hengrui/GSK; $1.1bn/$11.4bn for Innovent/Takeda; $1.2bn/$18.5bn for CSPC/AstraZeneca; $0.6bn/$15.2bn for Hengrui/BMS; $0.65bn/$10.5bn for Innovent/Pfizer; and $0.4bn/$15.51bn for Hansoh/Roche. These are announced transaction amounts, not forecasts of milestone collection. At the other extreme, only ten deals had upfront shares above 20%, mostly acquisitions, later-stage or approved assets, and regional licences: buyers were paying for greater certainty. [1,4–9]
4. Who writes the cheques?
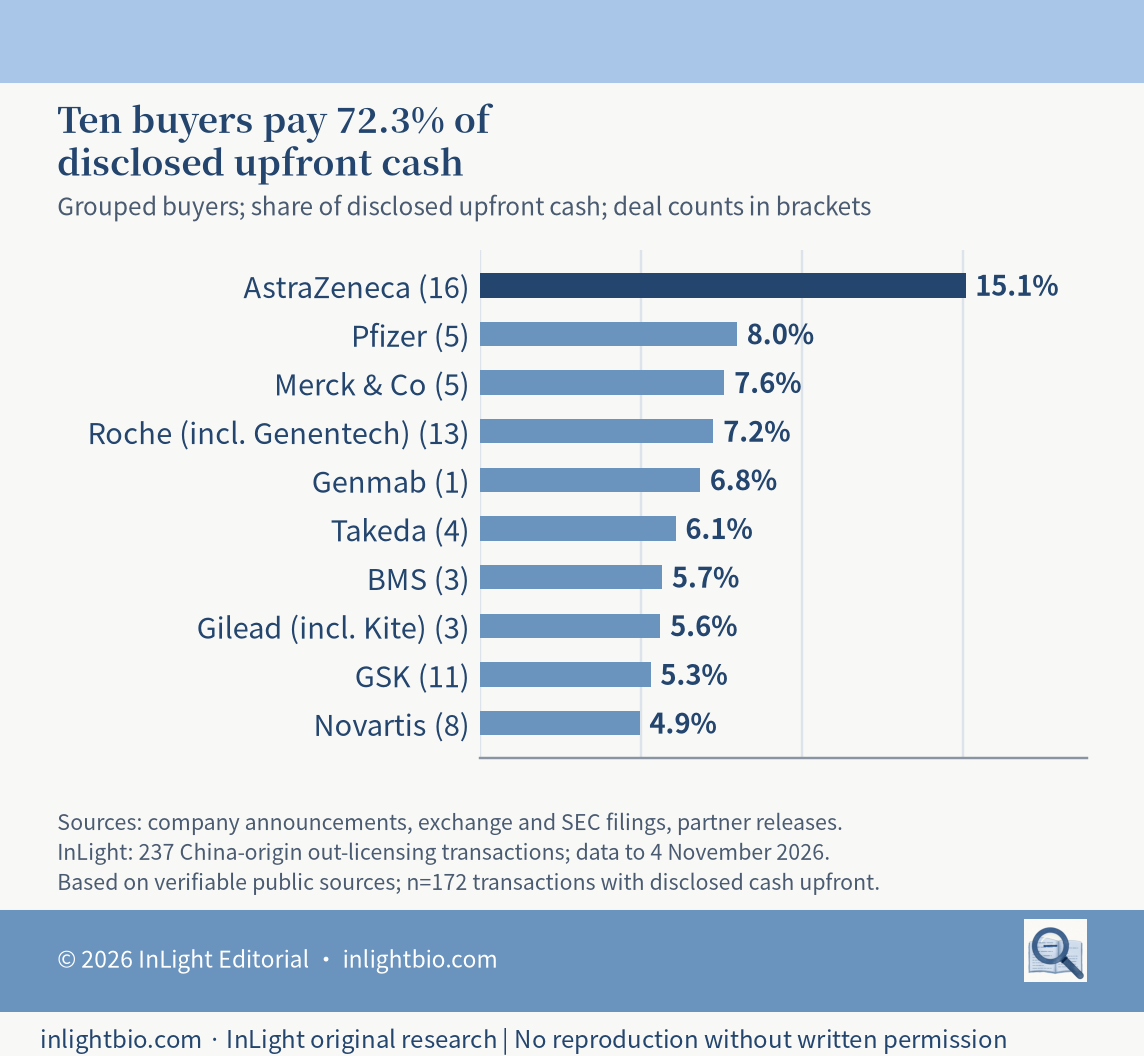
The ten buyers ranked by upfront paid 72.3% of all disclosed upfront cash. A separately ranked top ten by headline value accounted for 59.0% of headline value; these are not necessarily the same ten companies. [1]
AstraZeneca leads: 16 deals, approximately $4bn upfront and 15.1% of disclosed cash. Its activity spans CSPC's programmes, the Gracell acquisition and Dizal's sunvozertinib licence. Next come Pfizer, with five deals and approximately $2.1bn, and Merck & Co, with five and approximately $2bn. Roche, including Genentech, has thirteen deals; Genmab enters through one $1.8bn acquisition. Takeda, BMS, Gilead, GSK and Novartis complete the upfront top ten. [1,6,10,11]
BMS's three deals totalled approximately $24.7bn in headline value. Lilly signed ten but paid approximately $0.65bn upfront, outside the top ten. Frequent participation and large cash commitments are different things. [1]
Figure 2. Top-ten buyers' shares of disclosed upfront cash, n=172.
Buyer type matters too. Median upfronts were $113.5m for top-20 pharma, $47m for mid-cap pharma, $20m for biotech and $27.5m for venture-built NewCos. Median upfront shares were 6.8%, 2.4% and 2.7% for top-20 pharma, biotech and NewCos respectively. The overall $55m median hides different bidding populations. [1]
5. Sellers are concentrated too
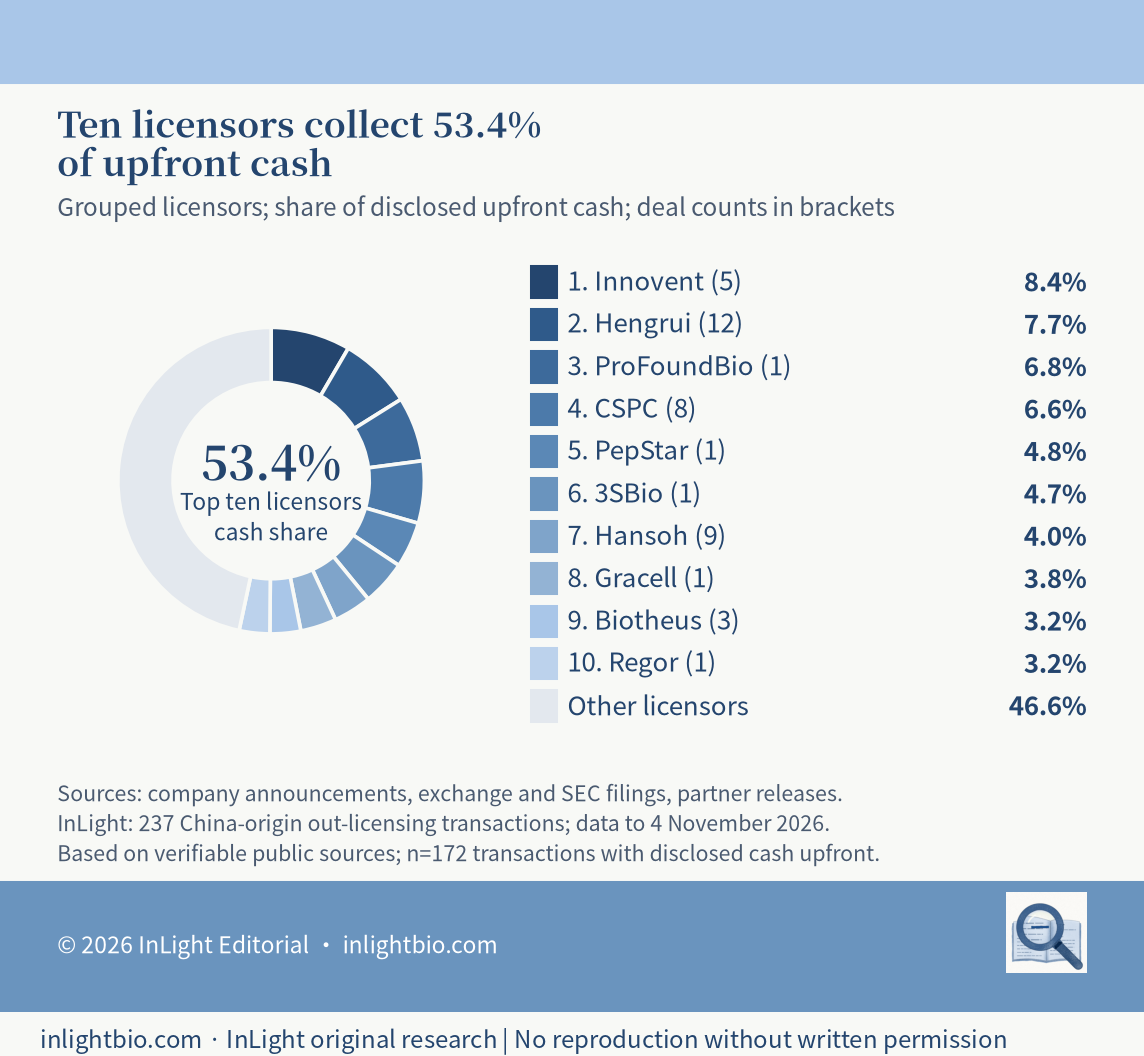
The ten licensors ranked by upfront collected 53.4% of disclosed cash; a separately ranked top ten by headline held 52.6% of headline value. Innovent led upfronts with five deals and approximately $2.2bn. Hengrui recorded twelve deals and approximately $45.3bn in headlines. Harbour BioMed, including Nona, had thirteen deals, but less than $0.5bn upfront. [1]
Figure 3. Top-ten licensors' shares of disclosed upfront cash, n=172.
Five licensors in the upfront top ten—ProFoundBio, PepStar, 3SBio, Gracell and Regor—each entered through a single deal. Hengrui, CSPC and Hansoh instead appeared through repeated licensing activity. A concentrated seller ranking therefore mixes repeat participants with companies or asset portfolios transformed by one large transaction. It should not be mistaken for a league table of recurring licensing revenues. [1]
6. Why headline values are high and upfronts low
A licence can be understood as the buyer's option: the upfront is the premium, milestones are contingent exercise prices, and termination for convenience permits abandonment. Of 25 public agreements, 21 contained convenience termination, always available only to the licensee. In ten agreements with separable milestone types, sales milestones represented a median 78% of milestone ceilings. [12]
This explains why a larger headline need not increase immediate cash. Contract structure leaves much of the uncertainty contingent on development and commercial success. For licensors, fewer buyers capable of large upfronts also means less scope to negotiate cash forward.
7. Coverage, interpretation and the next question
Our 2025 subset contains 72 deals and approximately $113.9bn of headline value, about 84% of DIA's cited industry total. Primary-source requirements leave smaller deals under-covered; this is not a census. [1,13]
The baseline covers 234 deals to 22 October 2026. Three targeted additions announced on 4 November bring it to 237—not a complete later sweep. Upfronts mean separable contractual cash, not verified receipt. Sino Biopharm's unsplit $358m upfront/near-term package is excluded; Hinova's $20m cash is included and its $10m warrants kept separate. Undisclosed terms are not estimated. [1,14–16]
Evaluate upfronts first, near-term development milestones second, and sales milestones and headlines last. Compare like development stages and territories; retained Greater China rights, regional licences and global licences are not interchangeable.
The practical question is not simply whether a headline is large enough. Ask which development events trigger near-term payments, how much depends on eventual sales, and what termination notice and cost-sharing provisions protect the licensor. Those contract details determine how much of an attractive announcement can ultimately be realised.
Next: Part 2 examines why a nominal $1bn licence can have a risk-adjusted value of approximately $80m.
Original InLight research based on public disclosures; not investment advice. Reproduction or redistribution requires written permission.
References
[1] InLight, China Biopharma Out-Licensing and NewCo Deal Survey Report (2026), transaction database: 237 core deals, primary-source records, data to 4 November 2026. Figures 1–3 calculated from this database.
[12] InLight agreement coding: 25 SEC public full-text agreements; convenience termination in 21/25, exclusively for licensees; sales milestones median 78% of milestone ceilings, n=10.
Part 2 | A Billion-Dollar License Has an Illustrative Risk-Adjusted Value of About $80 Million
By InLight Editorial
One question: What is a billion-dollar licensing headline worth after adjusting for risk and time?
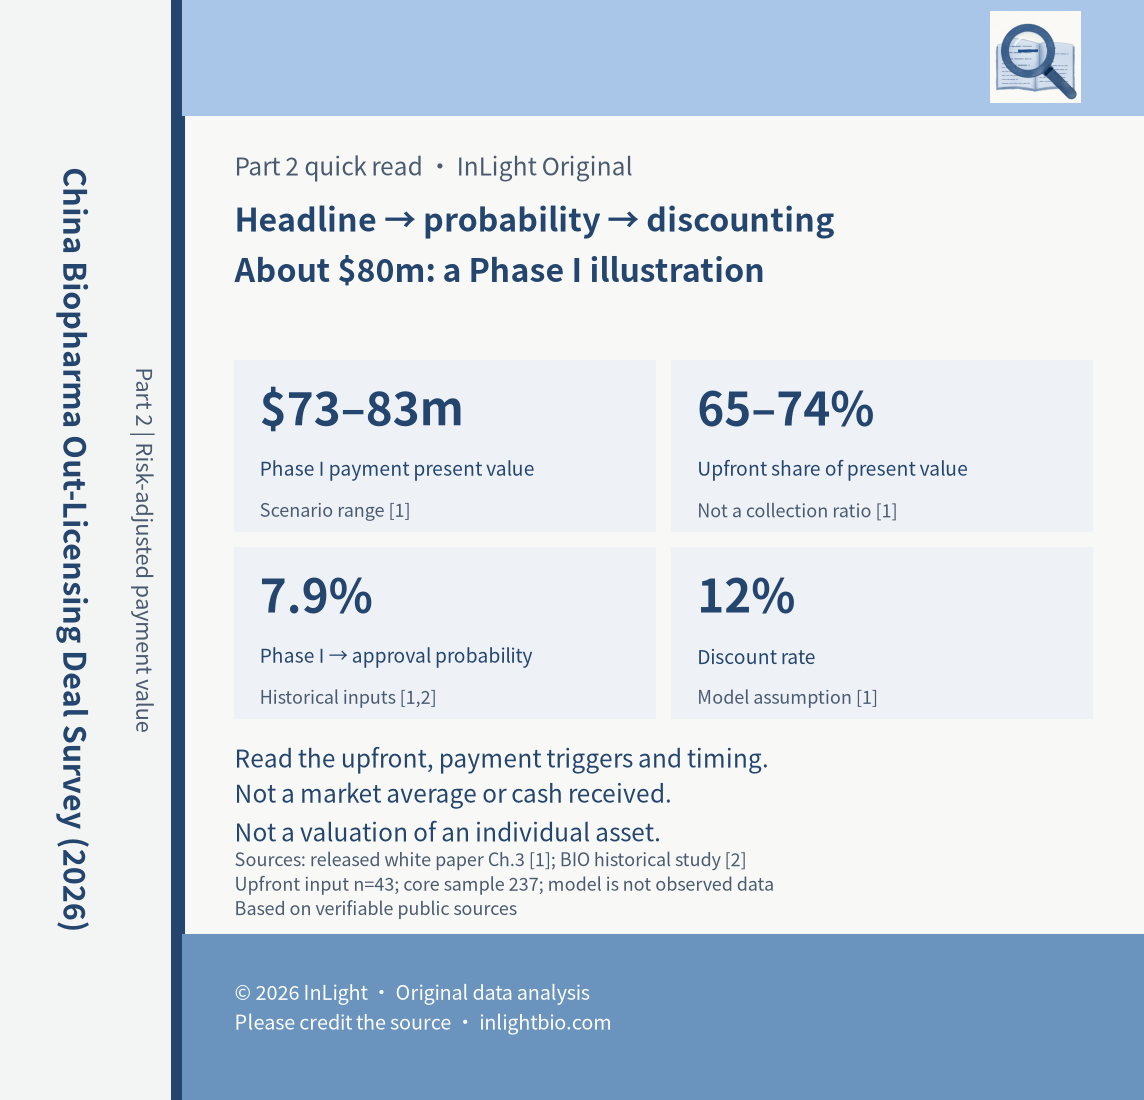
About $80 million, in the white paper's illustrative Phase I model—not as an observed market average. With a $1 billion headline and a 12% discount rate, the published scenarios produce approximately $73–83 million in risk-adjusted payment value. [1] This distinction belongs beside the headline, not buried in a disclaimer: the result is neither cash already received nor a valuation of any specific asset.
Part 2 quick read: headline, probability and time
The headline is a ceiling, not a receivable
Licensing announcements combine payments with different conditions. The upfront is treated as a signing-date payment in this simplified model. Development, regulatory and sales milestones depend on events that may happen later—or never. Adding those amounts describes a potential contractual ceiling. It does not show what the licensor owns in cash today.
Risk-adjusted net present value, or rNPV, weights future payments by the probability of reaching their triggering events and discounts them for time. Here the exercise concerns contractual payment streams. It is not a complete asset valuation net of every development obligation, and it excludes unmodeled royalties. [1] Contractual payment terms also do not establish that an upfront has actually arrived.
Separate sample statistics from assumptions
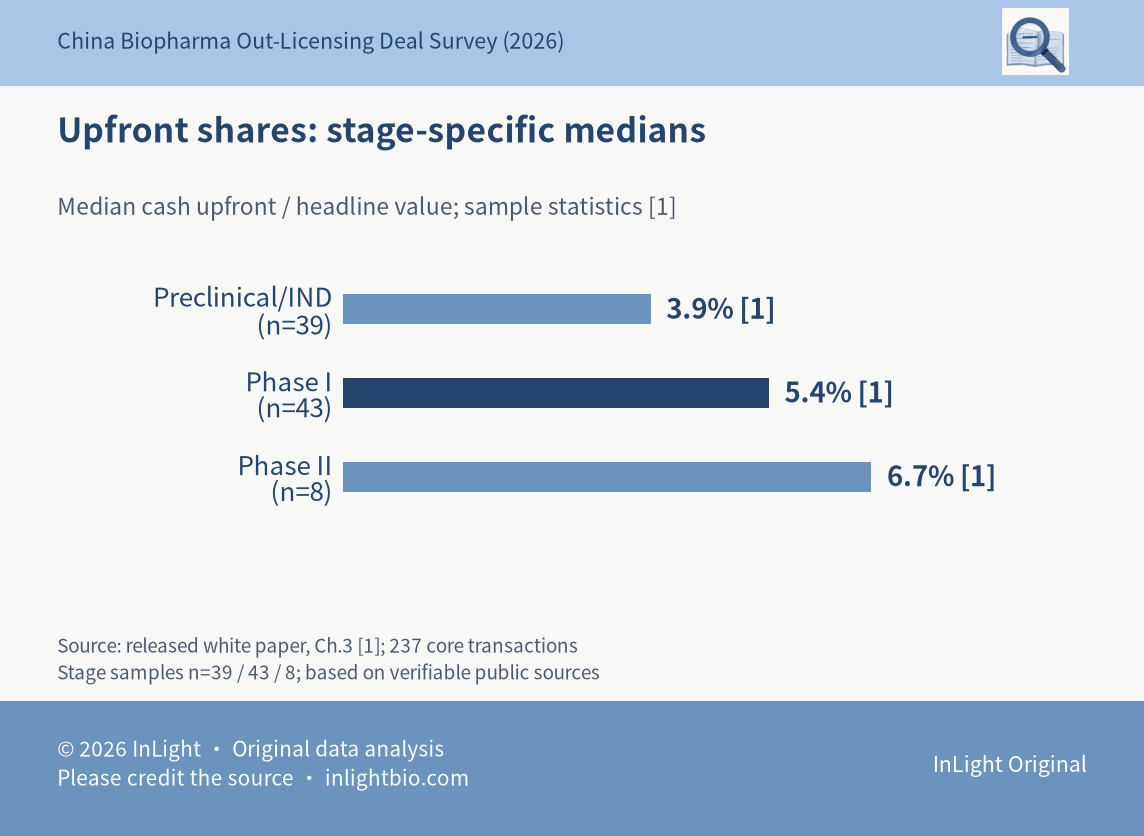
The released white paper covers 237 core transactions and 25 publicly available agreements. Its stage-specific median upfront shares are 3.9% for preclinical/IND deals, 5.4% for Phase I and 6.7% for Phase II, with respective sample sizes of 39, 43 and eight. [1] These are sample descriptions, not mandatory pricing benchmarks. The small Phase II sample is particularly important when interpreting comparisons.
Stage-specific median upfront shares
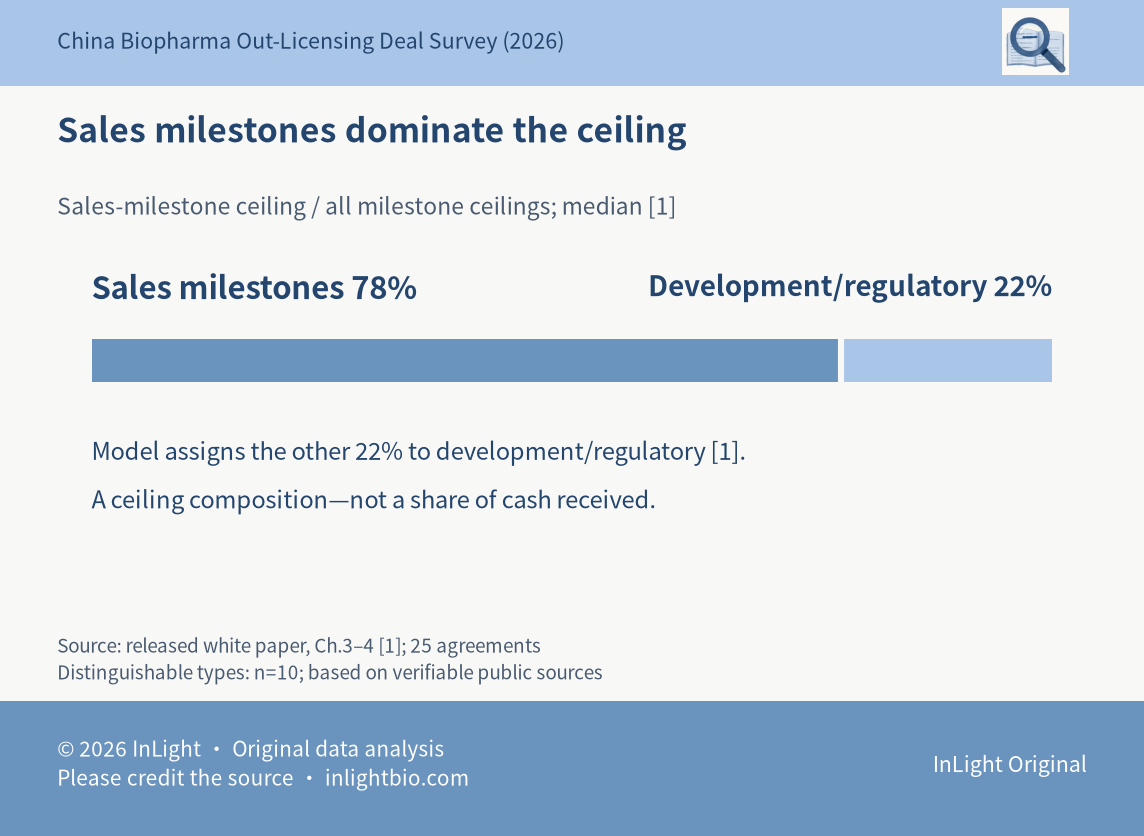
Among the agreements, only ten distinguish development and sales milestones sufficiently for this calculation. Their median sales-milestone share is 78% of the milestone ceiling. The model therefore assigns 78% of the non-upfront amount to sales milestones and 22% to development and regulatory milestones. [1] This is a ceiling composition, not the share of money eventually collected.
Median sales-milestone share of the milestone ceiling
Other inputs are assumptions: how development milestones are distributed across stages, sales milestones beginning roughly 2.5 years after approval, conditional sales-trigger scenarios of 25%, 50% and 100%, and a 12% discount rate. [1] Those probabilities are not observed payment frequencies, and the discount rate is not a measurement of each company's financing cost.
Probability and time apply different discounts
The model uses historical BIO/Informa/QLS transition rates: 52.0% from Phase I to II, 28.9% from II to III, 57.8% from III to submission and 90.6% from submission to approval. [2] These are historical, cross-indication averages, not a dedicated estimate for Chinese assets developed overseas or a claim to the latest forecast.
Multiplying the transitions gives approximately 7.9% cumulative approval probability from Phase I in the illustrative framework. At a 12% discount rate, a dollar payable ten years later is worth approximately $0.32 today. [1] Neither calculation means that every individual program has identical prospects. Together, they explain why a large, distant sales commitment can contribute relatively little to current value.
A better clinical package can change both the probability and the timeline. Conversely, a longer development program can delay milestones even without changing their nominal amounts. A credible comparison must make those assumptions visible rather than present a single, apparently exact answer.
The sample medians also do not reconstruct a real "average contract." Agreements differ in indications, territories and milestone definitions. Combining separate median inputs creates an explanatory scenario, not a transaction that necessarily exists in the database. Readers should not use the diagram to infer undisclosed terms for a named company, or assume that the same milestone structure applies across the entire market.
Where "about $80 million" comes from
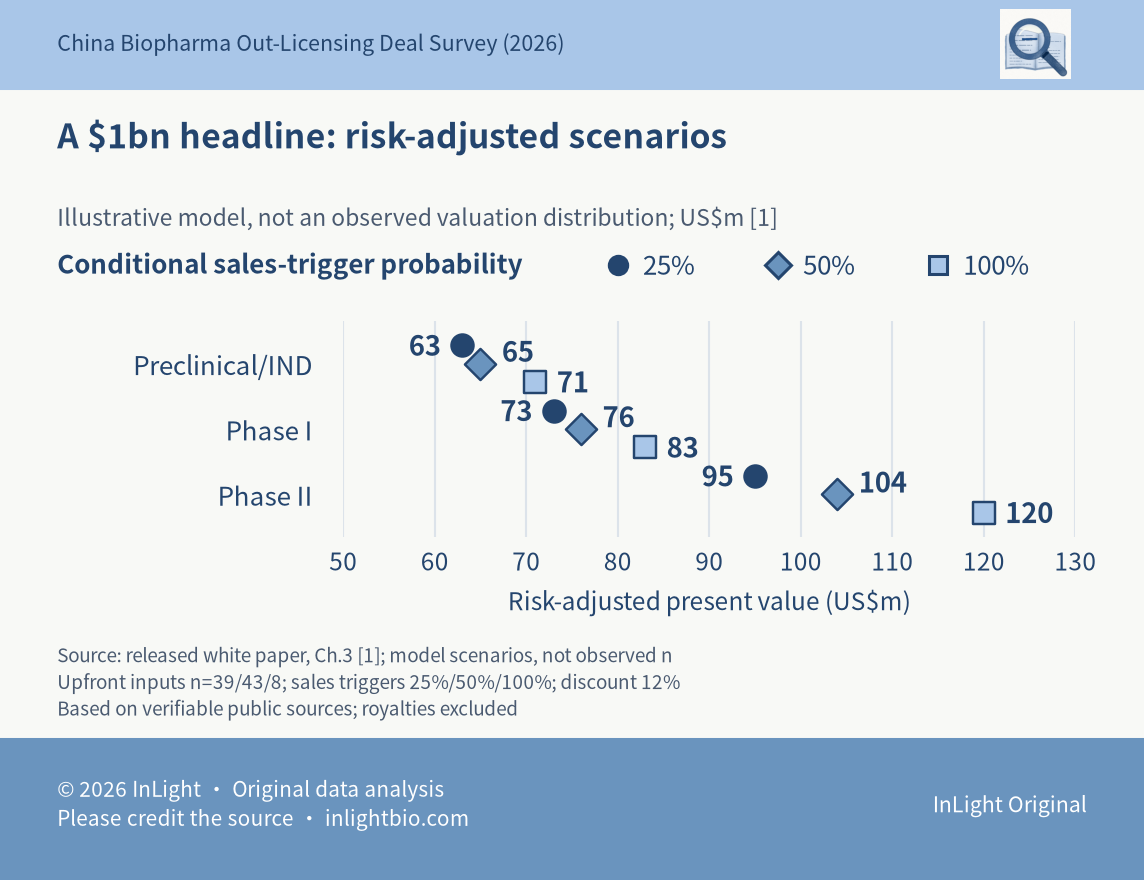
For the illustrative $1 billion Phase I license, the upfront is $54 million. At conditional sales-trigger probabilities of 25%, 50% and 100%, published risk-adjusted values are approximately $73 million, $76 million and $83 million. The upfront accounts for 65–74% of present value. [1] "About $80 million" summarizes that range; it is not an additional calculated mean.
Published risk-adjusted payment scenarios by signing stage
The same framework produces approximately $63–71 million for preclinical/IND signing and $95–120 million for Phase II. [1] Moving the signing stage changes the answer. The Phase I headline cannot therefore be applied unchanged to a preclinical program, a late-stage asset or an approved medicine.
Even the optimistic sales scenario retains the earlier development and approval risks. "All sales milestones trigger" means all trigger in the post-approval scenario—not that every program reaches approval. In the Phase I illustration, moving from the lowest to highest sales scenario adds only about $10 million to present value. [1] That is a sensitivity result, not proof that commercial milestones are worthless.
External studies are not validation of this model
Recon Strategy estimates, from clinical progress, that Phase I licenses could realize about 32% of potential value after nine years; its preclinical analysis estimates less than 20%. [3] These are modeled progress-based estimates, not audits of transaction-by-transaction cash receipts. Different denominators, observation periods and discounting prevent direct calibration of this rNPV illustration.
Nor should unrelated percentages be assembled into a single payment curve. Asset-specific efficacy, safety, competition, global development plans, rights and cost sharing can materially change economics. A useful model exposes those differences. It does not remove them by applying a universal haircut to every headline.
For a licensor comparing offers, align the development stage, licensed rights and payment definitions before testing assumptions. If a reasonable change in timing or probability reverses the ranking, retain that uncertainty explicitly. Choosing the most favorable scenario and reporting it as the answer would defeat the purpose of risk adjustment. The relevant decision is about conditional cash flows, not which announcement contains the largest number.
The practical reading rule
Start with contractual cash upfront, then examine near-term development milestones, then distant sales milestones. For each payment, check its trigger, timing and responsibilities. A larger headline alone does not establish a better offer. This installment's model is a tool for reading economic conditions, not a substitute for diligence, investment advice or a quotation for a particular asset.
References
[1] InLight, China Biopharma Out-Licensing and NewCo Deal Survey Report (2026), released Chinese white paper, Chapters 3–4. Published sample statistics, model inputs, scenarios and limitations.
Part 3 | 25 agreements analysed: only the buyer can walk away
By InLight Editorial
These counts come only from 25 agreements filed in full as SEC exhibits, some with redacted terms. The sample leans towards US-listed buyers and larger deals, so it cannot be extrapolated to all 237 transactions, and it is not legal advice.
One question: Who holds the right to walk away?
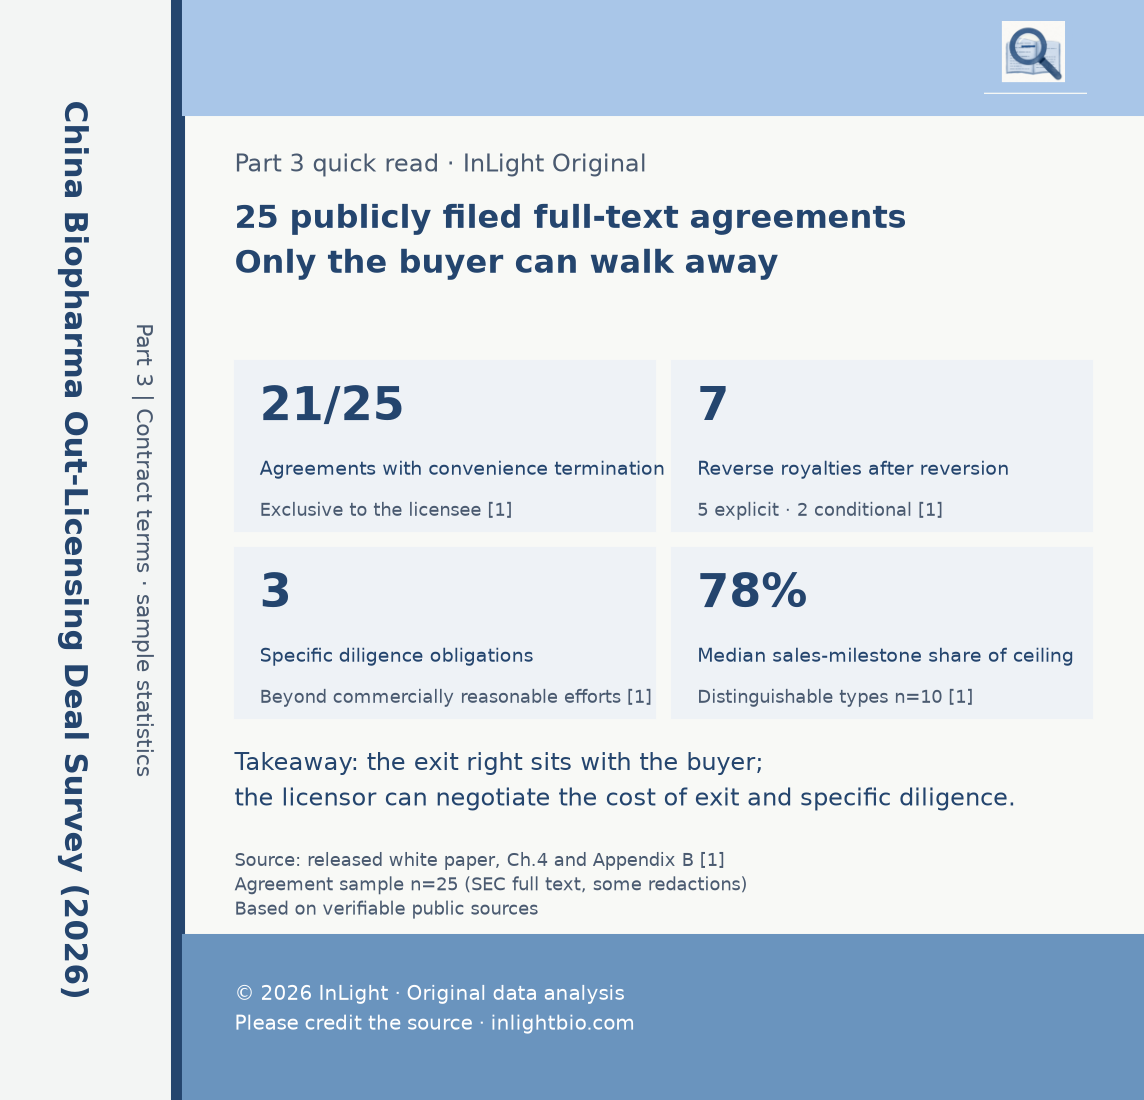
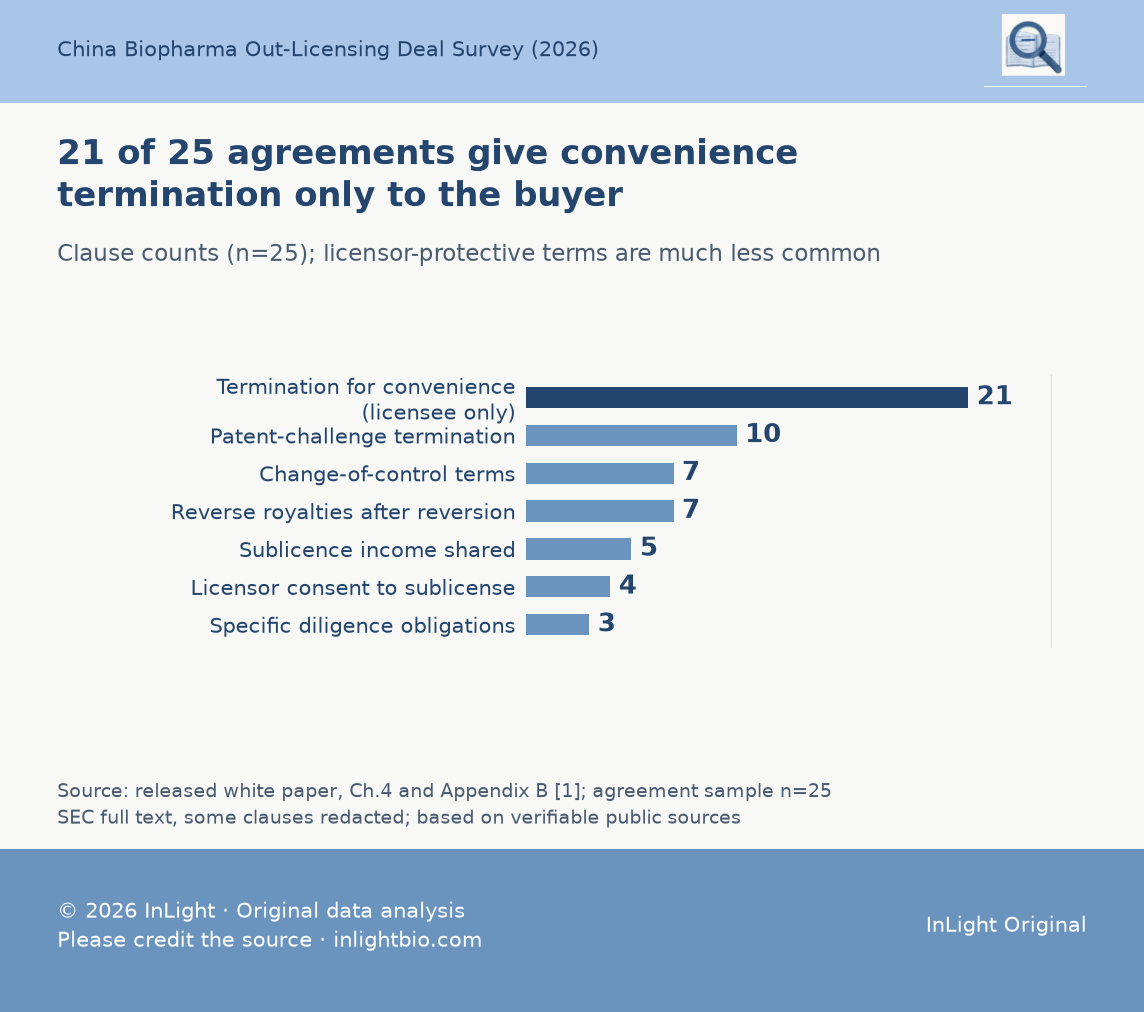
The buyer. Of 25 publicly filed full-text agreements, 21 contain a termination-for-convenience clause, and all 21 grant it only to the licensee. The licensor has no equivalent right. [1]
Part 2 asked what a "$1bn" licence is worth in a model. This part looks at the contract terms that decide whether that money arrives. With the exit right on the buyer's side, almost everything beyond the upfront depends on one condition: the buyer still wanting to continue.
Part 3 quick read: only the buyer can walk away
Why read the contracts
Press releases give the upfront and the headline total; termination, reversion, royalty and dispute terms sit in the contract. The full report coded 25 China-asset licence agreements filed as SEC exhibits, clause by clause, under one rule set; they correspond to 25 of the 237 sample transactions. The three deals announced on 4 November had not filed full agreements by 9 November and are not coded. [1]
Termination for convenience: 21 agreements, all for the buyer
Termination for convenience lets the licensee exit on notice without giving a reason. Visible notice periods run from 90 days (for example the Cullinan and Spero agreements) to 180 days (Corbus); the Simcere–NextCure agreement uses 90 or 180 days depending on whether the programme has reached the registrational stage; the remaining notice periods are redacted. [1]
The notice period decides how much time the licensor has to keep trials running, retain the team and find a new partner. Tiering by stage shows the term can be negotiated.
An external reference points the same way. Han Kun Law Offices reports that among its own 2025 projects, 47.8% of agreements included termination for convenience, up from 22.22% in 2024, and 72.7% of those granted it solely to the licensee. [2] That is a law-firm project sample, not a market census; its lower share may reflect that SEC-filed agreements come mostly from US-listed buyers, which more often write in unilateral exit rights.
Reversion is not a clean return
When a buyer exits, rights usually revert to the licensor. But seven agreements require the licensor to pay royalties to the former licensee if it continues developing and commercialising the asset after reversion: five explicitly, two conditionally (for example only when termination follows a licensor breach). [1] The licensor may get back an asset that still carries a payment obligation.
Clause counts in 25 publicly filed agreements
Licensor protections are rare
Protections for the licensor are much less common: termination if the licensee challenges the patents (10 agreements), explicit change-of-control terms (7), sharing of sublicence income (5), licensor consent to sublicensing (4), and specific diligence obligations beyond "commercially reasonable efforts" (3). [1]
Diligence matters most. Han Kun's 2025 data show 56.5% of its projects set specific diligence obligations, 53.8% deemed earlier milestones achieved when a later one is reached, and 52.2% included grant-back terms. [2] The samples differ, but specific diligence is clearly negotiable.
The largest part of the headline is the most distant
In the 10 agreements where milestone types can be separated, sales milestones make up a median 78% of the milestone ceiling (range 64.5%–98.7%; interquartile range 69%–91%). [1] They trigger only after launch and sales thresholds—and the buyer can terminate for convenience before then.
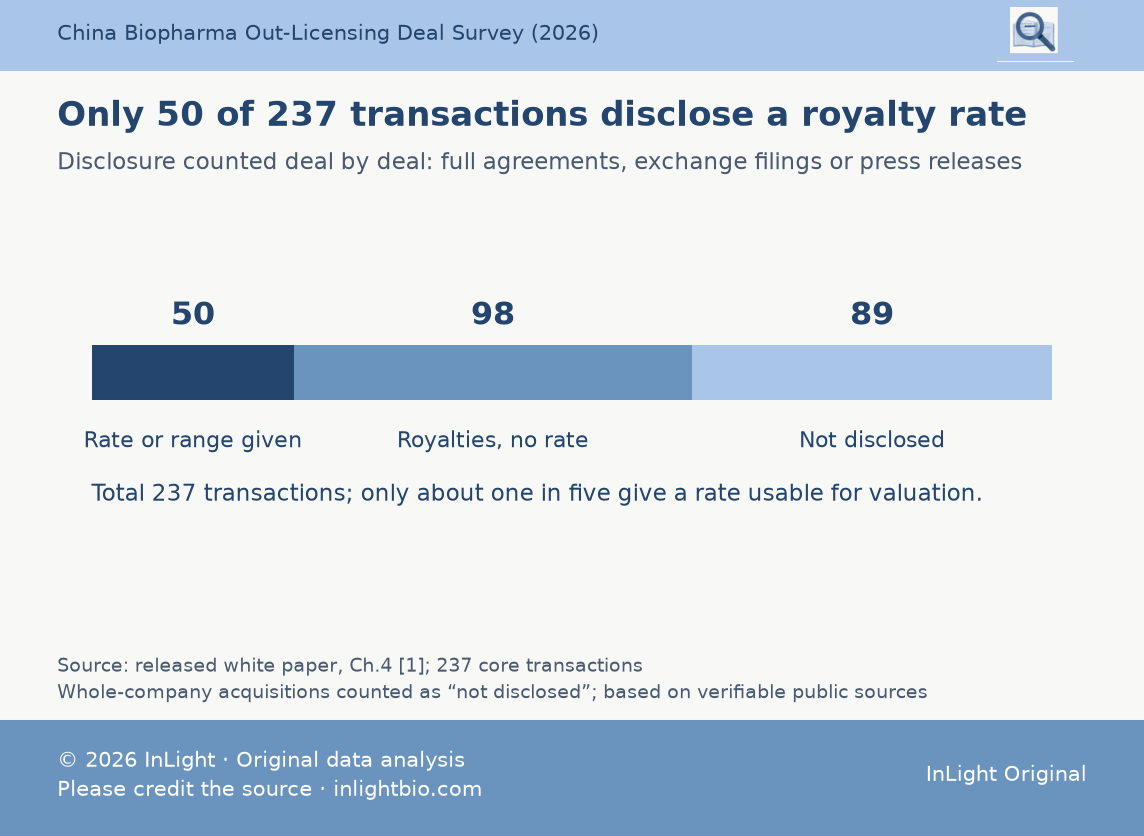
Royalties are the least disclosed term. Across the 237 transactions, 89 disclose no royalty terms at all, 98 mention royalties or tiered royalties without rates, and only 50 give a rate or range. [1] Nineteen agreements use arbitration, six seated in Hong Kong or Singapore; New York law predominates. [1]
Royalty-term disclosure across 237 transactions
The contract writes the buyer's option into terms
Treat a licence as the buyer's option: the upfront is the premium, sales milestones are the strike price, and termination for convenience is the right to abandon. [1] As long as that structure holds, the upfront share of headline value will not rise with bigger headlines—consistent with Part 1's median upfront share of 4.9%.
A licensor checklist: [1]
Termination for convenience: notice length, and whether it extends after the registrational stage.
Hand-back: free and orderly transfer of data, regulatory filings and ongoing trials.
Reverse royalties: whether any are payable after reversion, and whether only a licensor breach triggers them.
Diligence: a specific development timetable or minimum spend.
Protective terms: patent-challenge termination, change of control, sublicence income share and consent.
Disputes: governing law and seat of arbitration.
Key takeaway. In 21 of 25 public agreements, only the buyer can walk away. The licensor cannot remove that right, but can price it: notice, hand-back, reverse royalties and specific diligence.
Method note. This part cites the white paper's published agreement coding without re-sampling. SEC-filed agreements carry selection bias and redactions; only visible text is counted. The Han Kun figures come from a different sample and are directional only. Not legal or investment advice.
References
[1] InLight, China Biopharma Out-Licensing and NewCo Deal Survey Report (2026), Chapter 4 and Appendix B (25 agreements); Chapter 2 for upfront shares. 237 transactions.