Large-scale validation of a synthetic TCR library shows that, on average, only 56% of the VDJdb TCRs tested reproduce their annotated reactivity
Using the T-RAP synthetic TCR library and pooled screening to test VDJdb annotations, only 56% on average (n=2,667) reproduced the original reactivity; on the validated set, tcrdist3 and AlphaFold3 achieved mean AUROCs of 0.80 and 0.74, respectively.
T-RAP assembled 12,078 synthetic TCRs in 384-well plates, introduced the VDJdb-10 library (3,693 TCRs) into TCR-deficient Jurkat cells and screened them in pools, using the fifth-percentile P value of 468 negative-control TCRs as the threshold. On average only 56% (n=2,667) reproduced the annotated reactivity, ranging by epitope from 28.3% for NLV (91/322) to 76.3% for CIN (174/228). Taking arrayed co-culture of 77 TCRs as ground truth, concordance was 96.1%, with a 3.9% false-negative rate and no false positives. On the validated set, tcrdist3 and AlphaFold3 min-PAE reached mean AUROCs of 0.80 and 0.74. A zero-shot neoantigen test on 197 TIL TCRs from one melanoma patient gave AUROCs of 0.76–0.79.
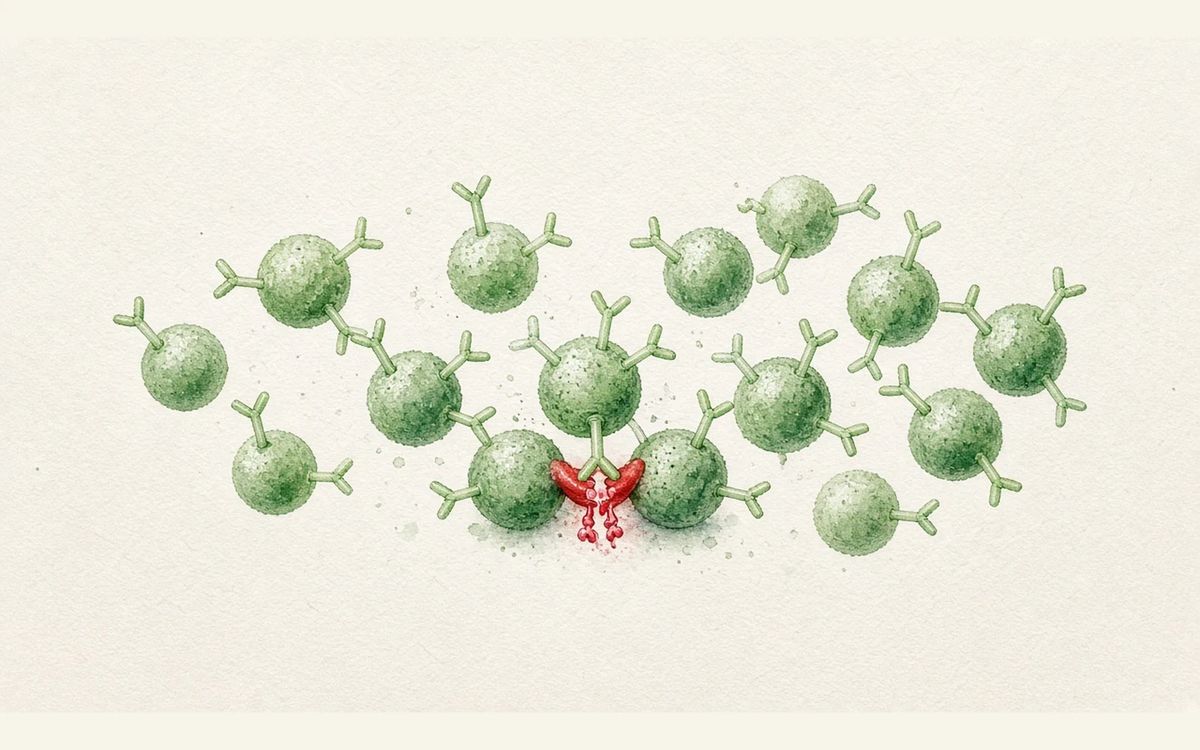
Key data card
- Study type: Preclinical methodology and computational evaluation study (synthetic TCR library, pooled functional screening and model evaluation; Immunity, peer-reviewed)
- Sample size n: 2,667 TCRs with annotated reactivity assessed in the functional screen; 77 TCRs validated by arrayed co-culture; multimer screening focused on YLQ and GLC; the neoantigen test used 197 TIL-derived TCRs from one melanoma patient
- Controls: 468 negative-control TCRs (annotated to irrelevant epitopes); arrayed co-culture as ground truth; non-cognate pMHC and non-validated TCRs as model controls
- Intervention/dose: T-RAP assembly of the VDJdb-10 TCR library (3,693 TCRs), introduced into TCR-deficient CD8αβ+ Jurkat cells, co-cultured with epitope-expressing HLA+ B cells, sorting the top 10% for CD69; three technical replicates at 500x coverage
- Primary endpoint: The proportion of VDJdb-annotated TCRs in the pooled functional screen that reproduced reactivity to their annotated epitope (validation rate; enrichment among CD69-high cells, PyDESeq2 Wald test, threshold set at the fifth-percentile P value of 468 negative-control TCRs)
- Primary endpoint result: 56% on average (n=2,667; the abstract states approximately 50%); from 28.3% for NLV (91/322) to 76.3% for CIN (174/228); against arrayed co-culture as ground truth, concordance was 96.1% with a 3.9% false-negative rate and no false positives
- Statistics: PyDESeq2 Wald test; Mann-Whitney U test (RTR versus neoantigen comparisons); AUROC and AUC PR for model evaluation; neoantigen test p=5.5×10⁻³ and 3.3×10⁻³
- Evidence level: Full text
- Verification record: Read the Cell Press open-access HTML full text: Summary, Introduction, Results (five subsections), Discussion, Limitations of the study, legends for Figures 1–5 and STAR Methods
- Robotic assembly of 12,078 TCRs in 384-well plates
- Jurkat cells co-cultured with B cells, sorting the top 10% for CD69
- On average only 56% of TCRs reproduced their annotated reactivity
- AlphaFold3 min-PAE scoring, mean AUROC 0.74
Background and open questions
Predicting TCR reactivity to pMHC is a long-standing goal in immunology, yet progress has been limited. The VDJdb and IEDB data used for training and evaluation come from many different experimental methods and sample sources; VDJdb provides confidence scores, but their value is unclear, and the proportion of genuinely reactive TCR-pMHC pairs in these databases has never been assessed.
The authors hypothesized that dataset quality itself may be a limiting factor. They therefore first built T-RAP, a platform for scalable assembly of synthetic TCRs, functionally validated thousands of reported TCR-pMHC pairs under uniform conditions, then used the validated data to evaluate tcrdist3 and AlphaFold3, and ran a zero-shot test on neoantigen TCRs from one melanoma patient.
Study design
A preclinical methodology and computational evaluation study, with no patient groups; all comparisons are descriptive or stand-alone tests, with no between-group power calculation. VDJdb was filtered to retain 6,307 entries, and TCRs annotated to the ten most densely represented epitopes were used to build the VDJdb-10 library (3,693 TCRs), eight of those epitopes (HLA-A*01:01 or A*02:01 restricted) being used for screening. T-RAP assembled the TCRs one by one in 384-well plates and retained an arrayed archive.
The TCR library was introduced into TCR-deficient CD8αβ+ Jurkat cells and co-cultured with immortalized B cells expressing the epitope and the matching HLA; the top 10% of cells for CD69 were sorted, in three technical replicates at 500x library coverage. Enrichment in the CD69+ fraction for each epitope was compared using the PyDESeq2 Wald test, and TCRs with a P value below the fifth percentile of the 468 negative-control TCRs were scored as validated, with a separate null hypothesis used to call non-validated TCRs and the remainder left indeterminate. Models were evaluated by AUROC and AUC PR.
Key results
Platform and library quality
T-RAP assembled 12,078 TCRs across five synthesis rounds, including 8,385 in TCR-s1 through TCR-s4, spanning tumor-derived and designed TCRs. UMI-ONT analysis of the VDJdb-10 library (3,693 TCRs) showed that 96.2% of TCRs were successfully assembled, with on average 79% of molecular sequences fully correct and only a 6.1-fold difference in TCR abundance between the fifth and 95th percentiles. Sanger sequencing of 82 randomly selected assemblies per library showed that >98% had the intended TCR as the dominant sequence.
Primary readout: annotation validation rate
In the functional screen, on average only 56% of the TCRs assessed (n=2,667) reproduced their annotated reactivity (the abstract states approximately 50%; the main-text figure is used here). By epitope, validation rates ranged from 28.3% for NLV (91/322) to 76.3% for CIN (174/228); by source study, they ranged from <10% to >95%. VDJdb's own confidence score showed only moderate precision and low sensitivity. All of these are descriptive proportions, with no between-group testing.
Screening accuracy and readout concordance
With arrayed co-culture of 77 TCRs as ground truth, the pooled screen was 96.1% concordant, with a 3.9% false-negative rate and no false positives; 49 TCRs were fully concordant between the CD69 readout in Jurkat cells and the CD137 readout in primary CD8+ T cells. Pooled multimer screening gave validation rates of 64.7% for GLC and 41.9% for YLQ, 93% concordant with the functional screen; of the 18 discordant TCRs, 15 were false negatives (6 multimer, 9 functional) with no false positives, and a further 3 YLQ TCRs bound without triggering signaling.
Discriminative power of the two models
tcrdist3 reached AUROCs of 0.87–0.93 for the GIL and YLQ epitopes, while AlphaFold3 min-PAE reached 0.84–0.88 for LLW and YLQ but only 0.58–0.61 for CIN and LTD; mean AUROCs were 0.80 and 0.74, respectively, though tcrdist3 requires reference TCRs of known reactivity. The AlphaFold3 RTR score ranked validated TCRs paired with their cognate pMHC above pairings with non-cognate pMHC for all 8 epitopes, with AUROCs of 0.83–0.90 for GIL and LTD and 0.65–0.66 for CIN and NLV.
Controls and zero-shot neoantigen test
Among controls, non-validated TCRs annotated to YLQ and GLC showed no RTR signal; TCRs with PDB structures did not score above average, and LTD and LLW, which have no structures in the training set, still performed. Among 197 TIL TCRs from one melanoma patient, AlphaFold3 zero-shot prediction gave AUROCs of 0.79 (p=5.5×10⁻³) for TNFAIP2 P>A (8 reactive TCRs) and 0.76 (p=3.3×10⁻³) for CCSER2 P>L (11 reactive TCRs), with AUC PR of 0.20 (random 0.04) and 0.28 (random 0.06).
Mechanistic interpretation
Demonstrated in the paper: Among the 77 TCRs tested in arrays, the pooled screen produced no false positives, and individual testing of a further 18 discordant TCRs likewise produced none; functional signaling and multimer binding were 93% concordant, so the low validation rate cannot simply be attributed to the readout. On the validated set, both tcrdist3 and AlphaFold3 min-PAE distinguished validated from non-validated TCRs (mean AUROCs of 0.80 and 0.74).
In control experiments, non-validated TCRs annotated to YLQ and GLC showed no RTR signal; TCRs with PDB complex structures showed no above-average RTR, and LTD and LLW performed despite having no structures in the training set, arguing against data leakage as the explanation.
Author hypotheses: The authors suggest that VDJdb errors may arise from non-specific multimer binding and from misassignment of the α chain in cells carrying two TCRα chains; the 3 YLQ TCRs that bound without signaling may reflect reverse docking or a lack of catch bonds. AlphaFold3 performance may be limited by three factors: model accuracy, scoring accuracy and model relevance; because multimer prediction was no better than signaling prediction for two epitopes, the authors consider force-induced conformational change an unlikely main cause.
Limitations and uncertainties
- TCRvdb covers only eight of the most extensively studied viral epitopes, is restricted to HLA-A*01:01 and A*02:01, and was measured in Jurkat reporter cells; the authors note the need to extend to more epitopes.
- The neoantigen test used only 197 TIL TCRs from a single patient (8 and 11 reactive), with AUC PR of 0.20 and 0.28; although above the random values of 0.04 and 0.06, the absolute levels remain low, and the authors note that AlphaFold3 performance must improve further before broad clinical use, with AUROCs of only 0.58–0.61 for CIN and LTD.
- Arrayed libraries are roughly 7.5-fold more uniform than pooled assembly (Rootpath, TCRAFT), but pooled methods can generate larger libraries without robotics, so diversity and sensitivity must be traded off; the validated set carries a 3.9% false-negative rate, which slightly underestimates performance on the first task; the mean AUROCs of tcrdist3 and AlphaFold3 were not formally compared.
Clinical and industry implications
If these results hold across more epitopes and HLA backgrounds, a substantial share of annotations in public TCR databases may need to be re-validated under uniform conditions, and earlier estimates of predictive model performance may have been too low. Validation rates varied widely across source studies, indicating that data quality itself affects how models are judged.
TCRvdb can serve as a validation set for assessing and improving models, and T-RAP can assemble any TCR library from sequence alone. With further improvement, structure prediction could provide a first-pass filter for patient-specific neoantigen TCRs; at present, however, the zero-shot test covers only one patient and is not clinical validation. VDJdb's confidence score shows only moderate precision, indicating that standardized validation is still needed beyond it.
Authors, source and verification
Evidence level: Full text; verification record: Read the Cell Press open-access HTML full text: Summary, Introduction, Results (five subsections), Discussion, Limitations of the study, legends for Figures 1–5 and STAR Methods
Messemaker M, Kwee BPY, Moravec Ž, Paauw Sd, Urbanus J, Álvarez-Salmoral D, et al. Functional evaluation of TCR-pMHC pairs at scale allows in silico TCR reactivity prediction. Immunity. 2026. https://doi.org/10.1016/j.immuni.2026.09.007
Primary field: Tumor immunology & cell therapy · Related: AI drug design, TCR-pMHC reactivity prediction, AlphaFold3, Synthetic TCR libraries (T-RAP), Pooled functional screening, VDJdb data quality
Summary of a published paper or preprint, written from the original text; numbers are as reported by the authors. Not medical or investment advice. Corrections: contact@
Related science
In vivo BCMA CAR-T phase 1: 15 months of follow-up, one ongoing sCR
Green CAR-T cells attacking a red myeloma cell at right
Targeting ZMYND8 increases effector-like exhausted T cells in mice and enhances immunotherapy responses
Green immune cells attacking red tumour cells

12 diet models: 4/6 obesogenic diets associated with anti-PD-1 response
Intestinal villi and microbiota at left, T cells and a red tumour at right
One email, with links to every paper. Reports and custom landscapes: contact@inlightbio.com.